Applications / Semiconductor
Reticle handling in EUV lithography: why every micron of vibration costs yield
The extreme positioning and vibration requirements for EUV reticle stages, and how motor choice shapes overlay and throughput
Reticle Handling in EUV Lithography: Why Every Micron of Vibration Costs Yield
Extreme ultraviolet (EUV) lithography at 13.5 nm wavelength has become the enabling technology for semiconductor manufacturing at the 5 nm node and below. The reticle (photomask) stage in an EUV scanner is one of the most demanding precision motion applications in existence. The reticle must be scanned at velocities above 2 m/s with positional accuracy below 1 nm, in a vacuum environment, while contributing zero particles to the optical path. Every nanometer of uncontrolled reticle vibration translates directly into overlay error and, ultimately, lost yield. The resonant frequency and stator design of the motor determines how much vibration the drive itself contributes.
This article examines the reticle stage requirements, the physics linking vibration to yield loss, and why motor selection (see the technology selection framework) is a pivotal design decision.
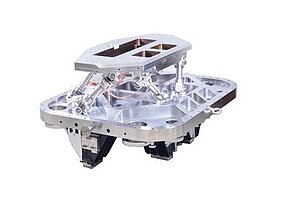
Image: Physik Instrumente (PI)
EUV Overlay Budget and the Reticle's Contribution
Modern EUV scanners target overlay specifications of 1.5 to 2.0 nm (3-sigma) for single-exposure layers. Multi-patterning layers tighten this to below 1.5 nm. The overlay budget is allocated across multiple contributors:
| Contributor | Typical allocation (nm, 3-sigma) |
|---|---|
| Wafer stage positioning | 0.3 to 0.5 |
| Reticle stage positioning | 0.3 to 0.5 |
| Lens aberration and distortion | 0.3 to 0.5 |
| Wafer process-induced distortion | 0.3 to 0.5 |
| Metrology and alignment | 0.2 to 0.3 |
| RSS total | ~1.5 to 2.0 |
The reticle stage receives an allocation of 0.3 to 0.5 nm. Because the reticle image is demagnified by 4x onto the wafer, a 1 nm error at the reticle produces 0.25 nm of overlay error at the wafer. This 4x reduction is helpful but not as generous as it might seem: the reticle stage must still hold 1 to 2 nm accuracy during scanning to stay within its budget.
The critical insight is that these allocations are root-sum-square (RSS) contributions. If the reticle stage exceeds its budget by even 0.2 nm, the total overlay degrades, and the process window shrinks. At advanced nodes, a 10% overlay degradation can reduce yield by 1% to 3%, which on a high-volume production line processing 100,000 wafers per month translates to millions of dollars in lost revenue.
Reticle Stage Architecture
An EUV reticle is a 152 x 152 mm, 6.35 mm thick glass substrate coated with a multilayer Bragg reflector (40 pairs of Mo/Si layers). The reticle mass is approximately 300 g. Unlike DUV (deep ultraviolet) reticles that are transmitted, EUV reticles are reflective, so the reticle stage must present the reticle face-down to the projection optics.
The reticle stage architecture shares the coarse-fine philosophy of wafer stages but with distinct requirements:
- Scanning axis (Y): 300+ mm travel at velocities up to 4 m/s, with accelerations of 40 to 80 m/s^2 during turnarounds.
- Cross-scan axis (X): Limited travel (a few millimeters) for reticle alignment.
- Focus (Z) and tilt (Rx, Ry): Fine corrections for reticle flatness and focus, typically within 1 micrometer range.
- Rotation (Rz): Fine yaw correction, sub-microradian range.
The scanning axis demands are extreme. To maximize throughput, the reticle must scan as fast as possible. The wafer stage scans at velocity v_w, and the reticle stage must scan at 4 * v_w (due to the 4x demagnification). For a wafer scan velocity of 0.7 m/s, the reticle velocity is 2.8 m/s. At turnarounds, the stage must decelerate from +2.8 m/s to -2.8 m/s in a few milliseconds, requiring accelerations of 40+ m/s^2 on a stage mass of several kilograms.
The Coarse Stage: Linear Motors Under Extreme Conditions
The coarse reticle stage uses moving-magnet or moving-coil linear motors to achieve the required velocities and accelerations. The motor must deliver peak forces of 200 to 500 N (stage mass of 5 to 10 kg at 40 to 80 m/s^2) while minimizing force ripple, heat generation, and magnetic stray fields.
These are among the most demanding linear motor applications in any industry. The force ripple specification is typically below 0.01% of peak force, which means force disturbances below 50 mN during 500 N peak acceleration. Achieving this requires:
- Ironless (air-bearing) motor topologies to eliminate cogging.
- High-resolution commutation using encoder feedback with sub-microradian angular resolution.
- Custom amplifier designs with current ripple below 0.1 mA RMS.
- Careful magnetic circuit design to minimize harmonic content in the motor force constant.
The Fine Stage: Piezoelectric Correction
Even with the best linear motors, the coarse stage cannot achieve sub-nm positioning during scanning. Force ripple, bearing noise, cable disturbances, and structural vibrations produce errors in the 5 to 50 nm range during scanning. The piezoelectric fine stage corrects these errors.
The fine stage typically provides 6 degrees of freedom: X, Y, Z translations and Rx, Ry, Rz rotations. Travel ranges are small (10 to 100 micrometers for translations, 10 to 100 microradians for rotations), but bandwidth requirements are severe: 1 to 3 kHz closed-loop bandwidth for the scanning axis (Y), and 500 Hz to 1 kHz for the other axes.
Piezo stack actuators in a flexure-guided stage provide the stiffness, bandwidth, and zero-friction characteristics needed for this application. A typical configuration uses 6 to 12 piezo stack actuators arranged in a Stewart platform or hexapod-derived geometry, coupling into a lightweight stage body made from silicon carbide (SiC) or Zerodur.
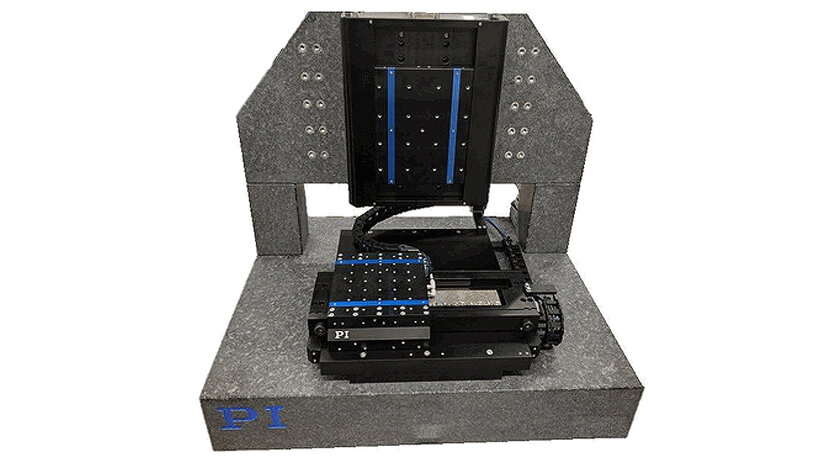
Image: Physik Instrumente (PI)
Vibration Sensitivity: How Nanometers Become Yield Loss
The relationship between reticle vibration and yield loss passes through several intermediate effects.
Image Blur
Vibration during the exposure integration time causes the aerial image (the projected pattern) to blur. For a vibration amplitude of A (peak) during exposure, the image contrast (normalized image log slope, NILS) degrades approximately as:
NILS_degraded = NILS_nominal * (1 - 2 * (pi * A / pitch)^2)
For a 26 nm pitch pattern (13 nm half-pitch at 4x demagnification = 52 nm pitch at reticle), a 1 nm reticle vibration amplitude produces:
NILS reduction = 2 * (pi * 1 / 52)^2 = 0.007, or 0.7%
This seems small, but NILS values at advanced nodes are already marginal (around 1.2 to 1.5 for aggressive patterns). A 1% reduction in NILS tightens the exposure-defocus process window by approximately 2%, which directly reduces yield.
Overlay Error
Vibration that is synchronized or correlated with the scanning motion produces systematic overlay error. If the reticle vibrates at the scanning frequency or its harmonics, the pattern is shifted consistently in one direction, producing overlay offset. Low-frequency vibration (below the scanner's control bandwidth) is the primary concern because the stage servo cannot correct it.
A 1 nm reticle position error at 4x demagnification produces 0.25 nm overlay error at the wafer. For the tightest multi-patterning layers with 1.2 nm overlay budget, 0.25 nm consumes 20% of the total budget from a single contributor. This directly reduces the available margin for all other contributors.
Stochastic Effects Amplification
At EUV wavelengths, photon shot noise is a significant contributor to pattern roughness and edge placement error. The number of photons per pixel at a resist dose of 30 mJ/cm^2 is approximately 30 to 50 for a 13 nm pixel. This produces inherent line edge roughness (LER) of 2 to 3 nm (3-sigma).
Vibration-induced image blur compounds stochastic effects. The combined effect of shot noise and vibration-induced blur is not simply additive; it is multiplicative in its impact on defectivity. A vibration-blurred image requires higher dose to achieve the same contrast, which reduces throughput. Alternatively, accepting the lower contrast increases stochastic defects, reducing yield.
Acceleration Profiles and Their Impact
The reticle stage acceleration profile during turnarounds is a major driver of vibration. A trapezoidal acceleration profile (constant jerk = 0) produces sharp transitions at the beginning and end of the acceleration phase. These transitions contain high-frequency content that excites structural resonances in the stage, the frame, and the projection optics.
Modern scanners use S-curve or higher-order smooth acceleration profiles to minimize jerk and snap (the time derivatives of acceleration). A well-designed S-curve profile limits the jerk to 10^6 m/s^3 and the snap to 10^8 m/s^4. These limits constrain how quickly the turnaround can be completed and therefore directly affect throughput.
Turnaround Time Calculation
Consider a reticle stage scanning at 2.8 m/s that must reverse direction. With a constant acceleration of 60 m/s^2:
Deceleration time from +2.8 to 0: 2.8 / 60 = 47 ms Acceleration time from 0 to -2.8: 47 ms Total turnaround (rectangular profile): 94 ms
With an S-curve profile (jerk-limited to 10^6 m/s^3):
Time to ramp acceleration to 60 m/s^2: 60 / 10^6 = 0.06 ms (negligible)
In this case, the jerk limit is not the binding constraint. The acceleration time dominates. However, the S-curve transitions reduce the peak vibration amplitude during turnarounds by 10 to 20 dB compared to a trapezoidal profile, depending on the structural resonance frequencies.
For a scanner processing 26 x 33 mm exposure fields, the reticle scan length (at 4x) is 104 to 132 mm. At 2.8 m/s scanning velocity, the scan time is 37 to 47 ms. The turnaround time (94 ms) exceeds the scan time, making turnaround efficiency the dominant throughput limiter. Faster turnarounds require higher accelerations, which increase vibration. This is the fundamental throughput-vibration tradeoff.
Settling After Turnaround
After the turnaround, the stage must settle to sub-nm accuracy before the exposure begins. The exposure cannot start until:
- The stage velocity matches the commanded scanning velocity within 0.01%.
- The stage position error is within the fine stage capture range (typically 10 to 50 micrometers).
- The fine stage has reduced the residual error below 1 nm.
The settling time depends on the vibration amplitude after the turnaround and the fine stage bandwidth. With a piezo fine stage at 2 kHz bandwidth, settling from 50 nm of residual vibration at 200 Hz to below 1 nm requires approximately:
Required attenuation: 50 nm to 1 nm = 34 dB Attenuation per cycle at 200 Hz with 2 kHz bandwidth: (2000/200)^2 = 100x = 40 dB
One cycle at 200 Hz is 5 ms. So the fine stage can settle the 200 Hz component in under one cycle (5 ms). Higher-frequency components settle even faster. The practical settling time is dominated by the lowest-frequency disturbance components, typically 2 to 10 ms for a well-designed system.
Motor Selection: Quantifying the Impact
To illustrate how motor choice affects scanner performance, consider three scenarios for the coarse reticle stage motor.
Scenario 1: Iron-Core Linear Motor
Iron-core motors offer the highest force density (up to 100 N/kg of motor mass) but produce cogging forces. Even with skewed magnets and optimized slot geometry, cogging force is typically 0.5% to 2% of peak force. For a 500 N peak force motor, this is 2.5 to 10 N of periodic force disturbance.
On a 10 kg stage, 10 N produces 1 m/s^2 of acceleration disturbance. At the cogging spatial frequency (say, 20 mm pitch at 2.8 m/s scanning velocity = 140 Hz), this produces position disturbance of approximately:
A = a / (2 * pi * f)^2 = 1 / (2 * pi * 140)^2 = 1.3 micrometers
This 1.3 micrometer disturbance far exceeds the fine stage travel range. Iron-core motors are therefore unsuitable for EUV reticle stage coarse positioning. They are used only in auxiliary axes (reticle loading, etc.) where vibration requirements are relaxed.
Scenario 2: Ironless Voice Coil Linear Motor
Ironless motors eliminate cogging entirely. Force ripple arises from commutation errors, current ripple, and end effects. Typical force ripple is 0.01% to 0.05% of peak force, or 50 to 250 mN for a 500 N motor.
250 mN on a 10 kg stage produces 25 mm/s^2 acceleration. At 140 Hz:
A = 0.025 / (2 * pi * 140)^2 = 32 nm
This 32 nm disturbance is within the fine stage capture range and can be rejected by a 2 kHz fine stage to below 0.3 nm (40 dB attenuation at 140 Hz with 2 kHz bandwidth: (2000/140)^2 = 204x = 46 dB). This is the baseline architecture for current EUV scanners.
Scenario 3: Ironless Motor with Optimized Fine Stage
By increasing the fine stage bandwidth from 2 kHz to 3 kHz (requiring a stiffer flexure and lighter stage body), the attenuation at 140 Hz improves to (3000/140)^2 = 459x = 53 dB. The residual error from motor force ripple drops to 32 nm / 459 = 0.07 nm.
This additional 7 dB of rejection may seem incremental, but it frees 0.2 nm of the overlay budget for other contributors, effectively relaxing the specifications on lens aberration, wafer stage accuracy, or process-induced distortion. At the margins of advanced node manufacturing, this flexibility is extremely valuable.
Reticle Clamping and Its Interaction with Vibration
The reticle must be clamped to the stage without distortion. EUV reticles are clamped electrostatically (to avoid particle generation from mechanical clamps) with flatness requirements below 50 nm peak-to-valley across the 104 x 132 mm patterned area.
The clamp stiffness affects the stage's dynamic behavior. A stiff clamp (high electrostatic force) couples the reticle rigidly to the stage body, ensuring that the reticle follows the stage accurately. A weak clamp allows the reticle to vibrate relative to the stage (a "chattering" mode), which produces overlay error that the stage position sensors cannot detect.
The first chattering mode frequency depends on the reticle mass (300 g), the clamp stiffness, and the reticle bending stiffness. For a well-designed electrostatic clamp, this frequency is above 5 kHz, safely above the fine stage control bandwidth. If the clamp force degrades (due to contamination or charging effects), the chattering frequency can drop into the control bandwidth, producing mysterious overlay degradation that is difficult to diagnose.
Vacuum Environment Considerations
The entire reticle stage operates in vacuum at pressures below 1 Pa (and in some zones, below 10^-3 Pa) to prevent EUV absorption by residual gas. This environment imposes several constraints on motor selection.
Outgassing
All materials in the reticle stage must meet stringent outgassing specifications. Total mass loss (TML) below 1% and collected volatile condensable material (CVCM) below 0.1% after 24 hours at 125 degrees Celsius are typical requirements. These specifications apply to motor insulation, adhesives, cable jackets, and sensor components.
Piezoelectric actuators, being primarily ceramic and metal, meet these requirements with standard aerospace-grade adhesives. Electromagnetic motors require specialized vacuum-rated insulation on their windings, which limits the maximum operating temperature and, consequently, the current density and force output.
Heat Rejection
In vacuum, heat rejection occurs only through radiation and conduction (no convection). Motor heat must be conducted through the stage structure to a temperature-controlled heat sink. Electromagnetic coarse stage motors dissipating 50 to 200 W require active liquid cooling of the motor housing. Piezoelectric fine stage actuators, dissipating 0.5 to 2 W, can often be cooled passively through the flexure structure, though active cooling is used for highest accuracy.
The thermal gradient from motor heat affects the refractive index of any residual gas (in low-vacuum zones) and can cause thermal distortion of the stage body and the projection optics mounting structure. Minimizing motor heat dissipation directly improves thermal stability and imaging performance.
Particle Generation
Particle contamination on an EUV reticle is catastrophic. A 50 nm particle on the reticle surface prints as a 12.5 nm defect on every die in every wafer exposed through that reticle. A single critical particle can reduce yield by the fraction of dice it affects, potentially 1% to 10% of the lot.
The reticle stage must generate zero particles. This eliminates any motor or bearing with sliding or rolling contacts. Air bearings (using residual gas in low-vacuum zones) and magnetic bearings are used for the coarse stage. The fine stage uses flexure guidance with no sliding contacts. Piezoelectric actuators, being solid-state devices with no moving parts other than the ceramic deformation itself, are inherently particle-free.
Thermal stability in vacuum
The vacuum environment amplifies thermal challenges for the reticle stage. Without convective cooling, all heat generated by the coarse stage motors and fine stage actuators must be removed through conduction to actively cooled surfaces. The thermal budget is strict: the reticle temperature must remain within 10 mK of the setpoint to prevent thermal distortion of the multilayer reflector.
A 0.01 °C (10 mK) temperature change in the 152 mm fused silica reticle substrate (CTE approximately 0.5 ppm/K) causes a dimensional change of:
ΔL = 152 mm × 0.5 × 10⁻⁶ /K × 0.01 K = 0.76 nm
This 0.76 nm distortion is comparable to the entire reticle stage overlay allocation (0.3 to 0.5 nm at the reticle, corresponding to 0.075 to 0.125 nm at the wafer through 4x demagnification). Thermal management of the reticle is therefore as critical as vibration control.
The coarse stage linear motors, dissipating 50 to 200 W during scanning, are the dominant heat source. These motors use liquid-cooled housings with coolant temperature controlled to ±0.01 °C. The coolant flow path must be designed to minimize temperature gradients across the motor housing; a single-pass flow with 5 °C temperature rise across the motor would create an unacceptable thermal gradient. Multi-pass or counter-flow cooling configurations limit the temperature gradient to below 0.5 °C.
The fine stage piezo actuators dissipate much less power (0.5 to 2 W total for all axes), but their heat load is delivered directly into the precision stage body. The heat path from actuator to cooled surface must be designed with thermal resistance below 2 °C/W to keep actuator-induced temperature distortion below 0.5 nm.
Control System Architecture
The reticle stage control system must coordinate the coarse and fine stages to maintain sub-nm accuracy during scanning at velocities above 2 m/s. The control architecture is hierarchical, with multiple nested feedback loops operating at different bandwidths.
Trajectory planning
The trajectory planner generates the reference position, velocity, and acceleration profiles for each scan and turnaround. The profiles must satisfy multiple constraints simultaneously:
- Maximum velocity: 2.8 to 4 m/s (determined by wafer stage scan speed and demagnification)
- Maximum acceleration: 40 to 80 m/s² (determined by motor force and stage mass)
- Maximum jerk: limited to 10⁶ m/s³ (to minimize structural excitation)
- Synchronization: the reticle trajectory must maintain a constant velocity ratio with the wafer stage during the exposure window, with velocity matching errors below 0.01%
The trajectory is computed offline (before the scan begins) as a series of polynomial segments, typically fifth or seventh order, that satisfy all constraints with continuous derivatives up to the snap (fourth derivative) level. Higher-order continuity reduces the high-frequency content of the commanded acceleration, reducing structural excitation and vibration.
Coarse stage servo
The coarse stage servo runs at 5 to 20 kHz sample rate with a bandwidth of 50 to 200 Hz. It uses a cascade control structure with an inner current loop (bandwidth 2 to 5 kHz), a velocity loop (bandwidth 200 to 500 Hz), and a position loop (bandwidth 50 to 200 Hz). The position feedback comes from a laser interferometer with 0.1 nm resolution.
The coarse stage servo also implements feedforward compensation: the known trajectory (acceleration and velocity profiles) is used to pre-compute the required motor force, which is added to the feedback controller output. Good feedforward can reduce the following error from 100 to 500 nm (feedback only) down to 5 to 20 nm (feedback plus feedforward). The residual error, dominated by model inaccuracies and disturbances, is passed to the fine stage for correction.
Fine stage servo
The fine stage servo runs at 20 to 100 kHz sample rate with a closed-loop bandwidth of 1 to 3 kHz. It receives its error signal from the difference between the interferometer reading (which sees the sum of coarse and fine stage positions) and the commanded trajectory.
The fine stage controller is typically a robust control design (H-infinity or mu-synthesis) that accounts for plant uncertainty at high frequencies. The challenge is that the fine stage flexure has multiple resonance modes above the control bandwidth, and these modes must be either notch-filtered or gain-stabilized to prevent instability.
A typical fine stage in a scanning axis has:
- First resonance at 2 to 4 kHz (the primary suspension mode, within the control bandwidth)
- Second resonance at 5 to 8 kHz (a higher-order flexure mode, near the Nyquist frequency)
- Third resonance at 10 to 15 kHz (structural modes of the stage body)
The controller must provide high gain below 1 to 3 kHz (for disturbance rejection) while rolling off quickly above the first resonance and notch-filtering the higher modes. This requires careful system identification of the plant dynamics, typically performed using swept-sine or multisine excitation with sub-nm positioning noise during the identification experiment.
Synchronization between reticle and wafer stages
During the exposure window, the reticle and wafer stages must maintain synchronized scanning motion with position matching errors below 0.5 nm (at the wafer). The synchronization controller operates as a master-slave system: the wafer stage is the master (it defines the exposure window timing), and the reticle stage follows with a fixed velocity ratio.
Synchronization errors arise from differential disturbances (floor vibration, cable forces) acting on the two stages independently. The synchronization controller measures the relative position error (reticle position / 4 minus wafer position) and drives it to zero using the fine stage actuators of both stages.
The synchronization bandwidth is limited by the communication latency between the two stage controllers. With a shared real-time network running at 20 kHz, the achievable synchronization bandwidth is approximately 1 kHz, sufficient to reject differential disturbances below 100 Hz with 40 dB attenuation.
Throughput Implications of Motor Performance
Modern EUV scanners achieve throughputs of 160 to 200 wafers per hour (wph) at doses of 20 to 30 mJ/cm^2. The reticle stage turnaround time is one of the top three throughput limiters (along with wafer stage overhead and resist sensitivity).
For a scanner operating at 185 wph processing 26 x 33 mm fields on a 300 mm wafer:
- Fields per wafer: approximately 80 (depending on layout)
- Reticle scans per field: 1
- Total reticle scans per hour: 80 x 185 = 14,800
- Time per scan cycle (scan + turnaround + settling): 3600 / 14,800 = 0.24 seconds
- Scan time at 2.8 m/s over 132 mm: 47 ms
- Available for turnaround + settling: 240 - 47 = 193 ms
With current motor technology, the turnaround consumes approximately 100 ms and settling requires 5 to 10 ms, totaling 110 ms. The remaining 83 ms is consumed by wafer stage synchronization, exposure triggering, and other overhead.
Improving fine stage bandwidth from 2 kHz to 3 kHz might save 2 to 3 ms per scan cycle. Over 14,800 cycles per hour, that saves 30 to 44 seconds per hour. At 185 wph, each wafer takes 19.5 seconds. The 30 to 44 seconds saved translates to 1.5 to 2.3 additional wafers per hour, a 1% throughput improvement. On a scanner that generates $100M+ of revenue per year in wafer output, a 1% throughput improvement is worth over $1M annually.
Future Directions
Next-generation EUV systems (High-NA EUV at 0.55 NA) change the reticle stage requirements significantly. The anamorphic optics in High-NA systems use 4x demagnification in one axis and 8x in the other. This means the reticle must scan at 8x the wafer velocity in one direction, pushing reticle velocities above 5 m/s and accelerations above 100 m/s^2.
These requirements intensify every aspect of the motor selection challenge. Higher velocities mean higher force ripple at higher frequencies. Higher accelerations mean higher turnaround vibrations. The fine stage bandwidth requirement increases proportionally.
Research into novel actuator technologies, including electrostrictive PMN-PT actuators with lower hysteresis than PZT, and hybrid piezo-electromagnetic stages that combine the bandwidth of piezo with the range of voice coils, is active at all major scanner manufacturers. However, the basic architecture of a high-speed electromagnetic coarse stage with a high-bandwidth piezoelectric fine stage is expected to remain the dominant solution for the foreseeable future.
The engineering challenge is incremental but relentless: each scanner generation demands 10% to 20% better vibration performance, 10% to 20% higher throughput, and tighter overlay. Motor selection and stage design are at the center of this continuous improvement, and piezoelectric actuators will remain the enabling technology for the fine positioning stage.
Reticle Lifetime and Handling Budget
EUV reticles cost $300,000 to $500,000 each and have finite lifetimes determined by pellicle degradation, reflectivity loss from carbon contamination, and cumulative mechanical exposure to the scanner environment. The reticle stage's handling quality directly affects reticle lifetime.
Mechanical stress during scanning
The reticle experiences accelerations of 40 to 80 m/s² during turnarounds. For a 300 g reticle, this produces inertial forces of 12 to 24 N. The electrostatic clamp must maintain grip with margin; a clamp force of 50 to 100 N is typical, providing a safety factor of 2 to 4 against reticle slippage.
However, the combination of high acceleration and electrostatic clamping stresses the reticle substrate. Fused silica has excellent fatigue resistance, but micro-cracks from handling or edge defects can propagate under repeated high-acceleration loading. Scanner manufacturers specify maximum acceleration limits that provide a reticle mechanical lifetime of at least 100,000 scans, corresponding to roughly 1,000 to 2,000 wafer lots.
Contamination from stage operation
Even in the cleanest vacuum environment, the reticle accumulates contamination from the scanner's internal sources: outgassing from stage components, sputtered material from the EUV-exposed pellicle, and secondary particles from the plasma environment around the EUV source. The reticle stage contributes to this contamination budget through:
- Outgassing from motor insulation, cable jackets, and adhesives (controlled to below 10⁻⁸ Pa·L/(s·cm²) through material selection and bakeout)
- Wear particles from any mechanical contact (eliminated by using flexure guidance and electrostatic clamping)
- Thermal desorption from heated motor surfaces (managed through active cooling)
The total contamination budget for the reticle stage is typically allocated at less than 0.1 nm of carbon equivalent deposition per 1000 hours of operation. This is verified through residual gas analysis (RGA) monitoring of the reticle environment during scanner operation.
Load and unload sequences
Loading and unloading the reticle from the scanner is a critical handling step. The reticle must be transferred from its carrier pod (a SMIF pod or EUV-specific container) to the stage clamp without particle generation, contamination, or mechanical damage.
The transfer sequence involves a robotic handler that grips the reticle by its edges, moves it through an airlock into the vacuum chamber, and places it on the electrostatic chuck. The entire sequence takes 10 to 30 seconds and must maintain:
- Zero particle generation (no contact between reticle surfaces and any hard surface)
- Position placement accuracy of ±50 µm (within the stage alignment capture range)
- Acceleration below 5 m/s² during transfer (to prevent reticle vibration in the handler's grip)
- Vacuum integrity (the airlock must pump down without generating turbulent flow that could deposit particles)
The piezo fine stage plays no role during load and unload; these operations are handled by the robotic handler and coarse stage alignment routines. However, the fine stage calibration must be verified after each reticle exchange, because the reticle's position on the chuck varies by ±50 µm from load to load, and the clamp-induced distortion pattern changes accordingly.